







Select Your Signal Provider
Most investors are only interested in the price of stocks moving up over the long term. They are missing out on the significant price movements that take place every day. Online trading gives access to leverage, more markets, low commissions, and the ability to profit from rising AND falling prices. With the right trading strategy, traders can have a more flexible and potentially lucrative way to achieve their income and capital growth goals, and we want to show you how you can do it too.
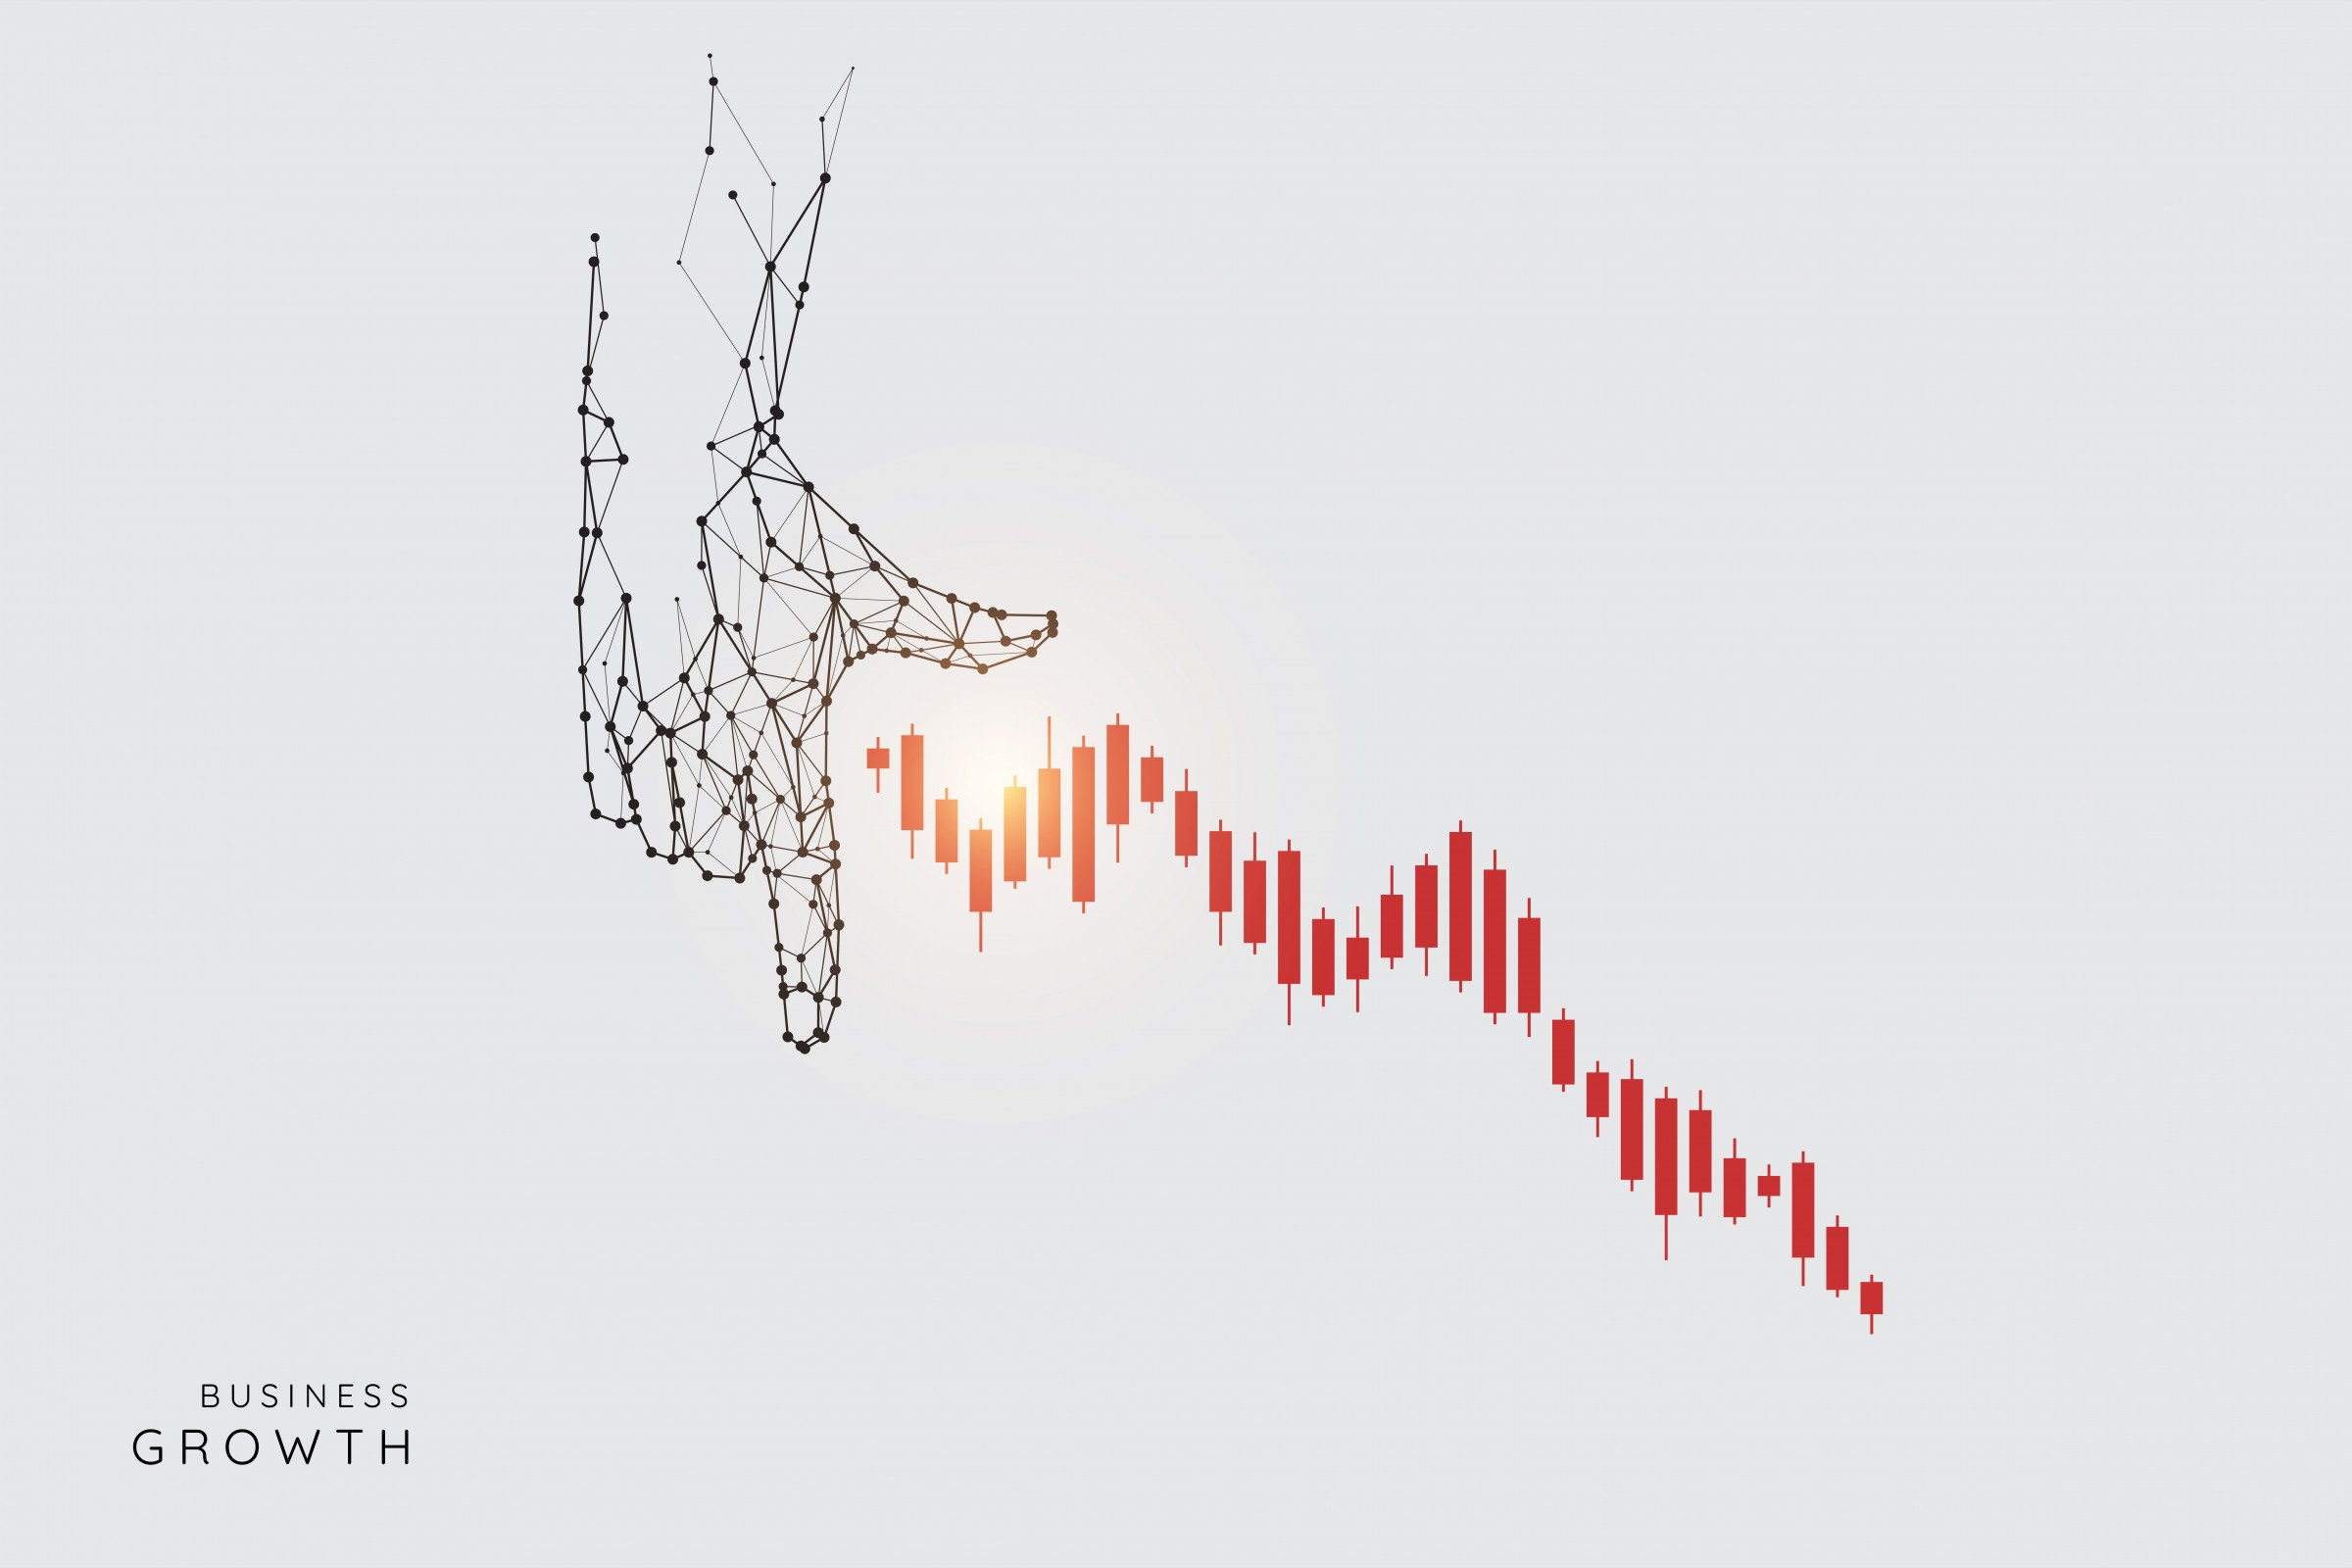
The right signal provider can impact your potential for profit and influence your long-term decision-making. Choose wisely among these recommendations considering your needs, budget, trading style, and risk tolerance. Often, a mixture of forex signals is more powerful than living and dying by just one figure.
The more you use these signals, the better you can predict movement in the market, when to buy, when to sell and when to hold. The more indicators you review, the more informed your decisions will be. Creating a strategy is easy when you have reliable and diverse information.
Bollinger Bands (BB)
Bollinger Bands were created by John Bollinger to demonstrate the moving average in the middle of the upside and downside of that average. This indicator can either open up, indicating a bullish market, or the lines can squeeze, indicating a bearish market. If the bands are rejected by the current price movement, that is a possible market entry. Meanwhile, a breakout from a current trend could indicate a possible trade.
Directional Movement Indicator (DMI)
Another indicator, the directional movement indicator (DMI), can be useful in getting a sense of whether or not prices are trending in a particular direction or not, as well as the strength of the trend if any.
Historical Volatility
The calculation of historical volatility can help you assess the risks involved in taking a trade based on past price action, which can also give you an idea of what sort of position size you should take on a risk-weighted basis. Higher historical volatility signals greater risk.
Oscillators
Oscillators are technical indicators often used in technical analysis to determine overbought and oversold market conditions. One of the most popular technical indicators of this type that can be used to generate forex signals is the Relative Strength Index (RSI).
Relative Strength Index (RSI)
The RSI is a bounded momentum indicator with a range of 0 to 100, and it can signal that a possible trend reversal is likely when it moves into extreme territory.
A reversal in a rising market can be signaled when the RSI indicator is overbought above the 80 levels, while a reversal in a declining market can be signaled by an oversold condition when the index falls below 20. The divergence between the price and RSI when the indicator is in the extreme territory above 80 or below 20 gives an even stronger market reversal signal.